Categories
Author: John Sharp
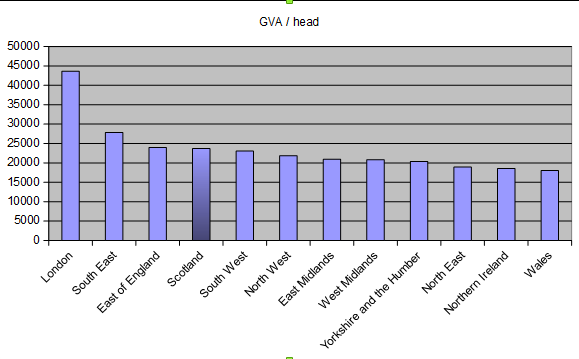
ONS publishes data which illustrates the best-performing areas in UK, in terms of Gross Value Added (GVA) per capita. The areas are the 12 NUTS1 regions of the UK. As the graphic shows, Scotland compares well with any of these regions outwith the Capital Region and others in south east of England.
ONS provides data on fiscal balances (surplus or deficit) for 12 areas of the UK. (There is also a thirteenth, Ex-Regio, for oil and gas). All those outside of Capital Region and the south east of England run fiscal deficits. For Scotland, the results are published as GERS. This is how GERS compares to the other areas within UK which run fiscal deficits.
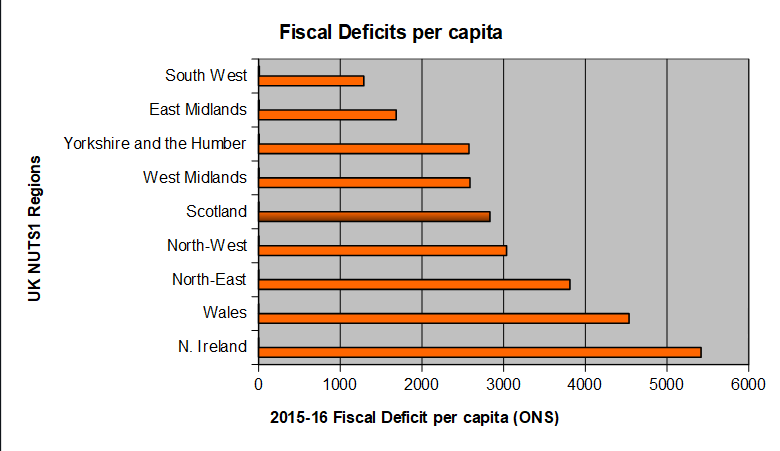
For comparison, the graphic below shows all UK NUTS1 regions, including those which have a fiscal surplus.

.
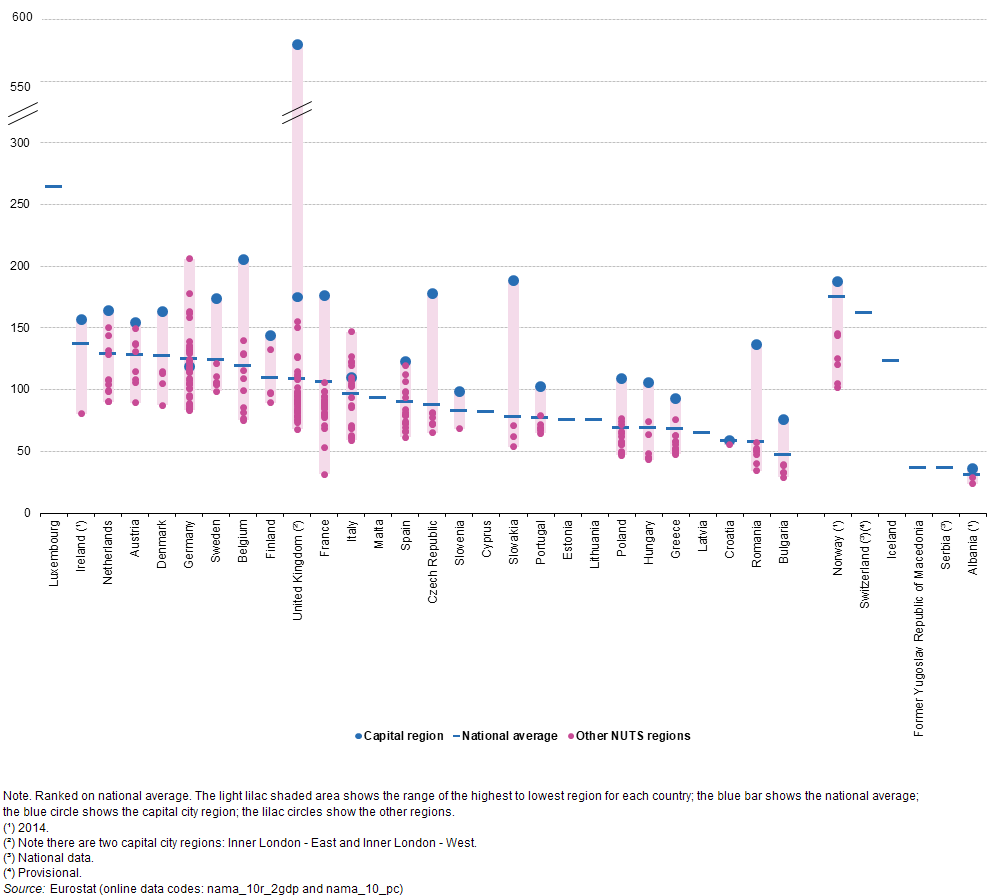
Gross domestic product (GDP) per inhabitant in purchasing power standard (PPS) in relation to the EU-28 average, by NUTS 2 regions, 2015 (% of the EU-28 average, EU-28 = 100) RYB17.png – Statistics Explained
Which is the country that stands out for centralising the economy to its capital region?
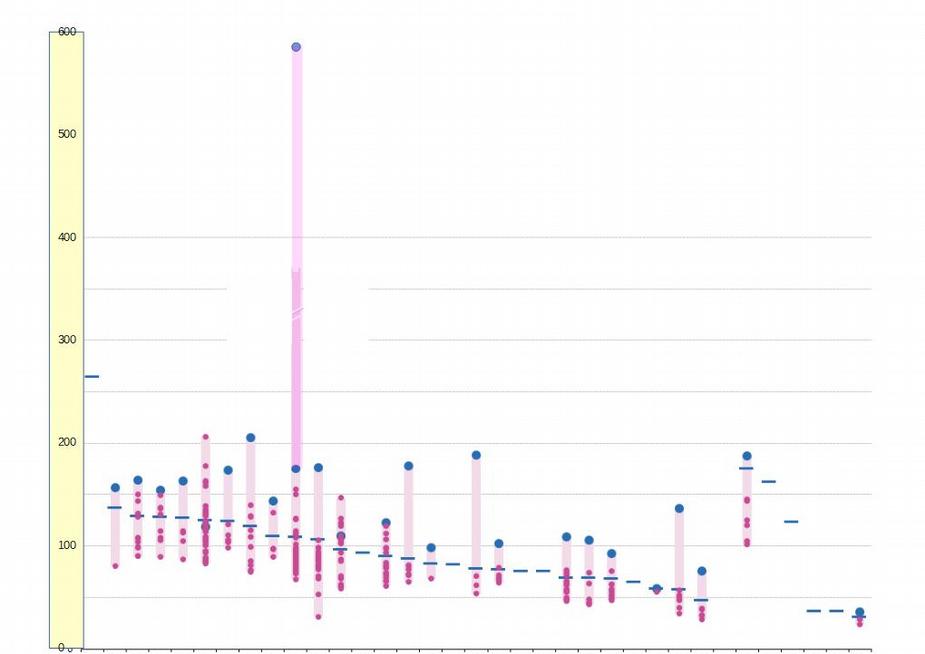
The country that stands out by nearly an order-of-magnitude from the others is UK. Below is the graphic with the country labels included.
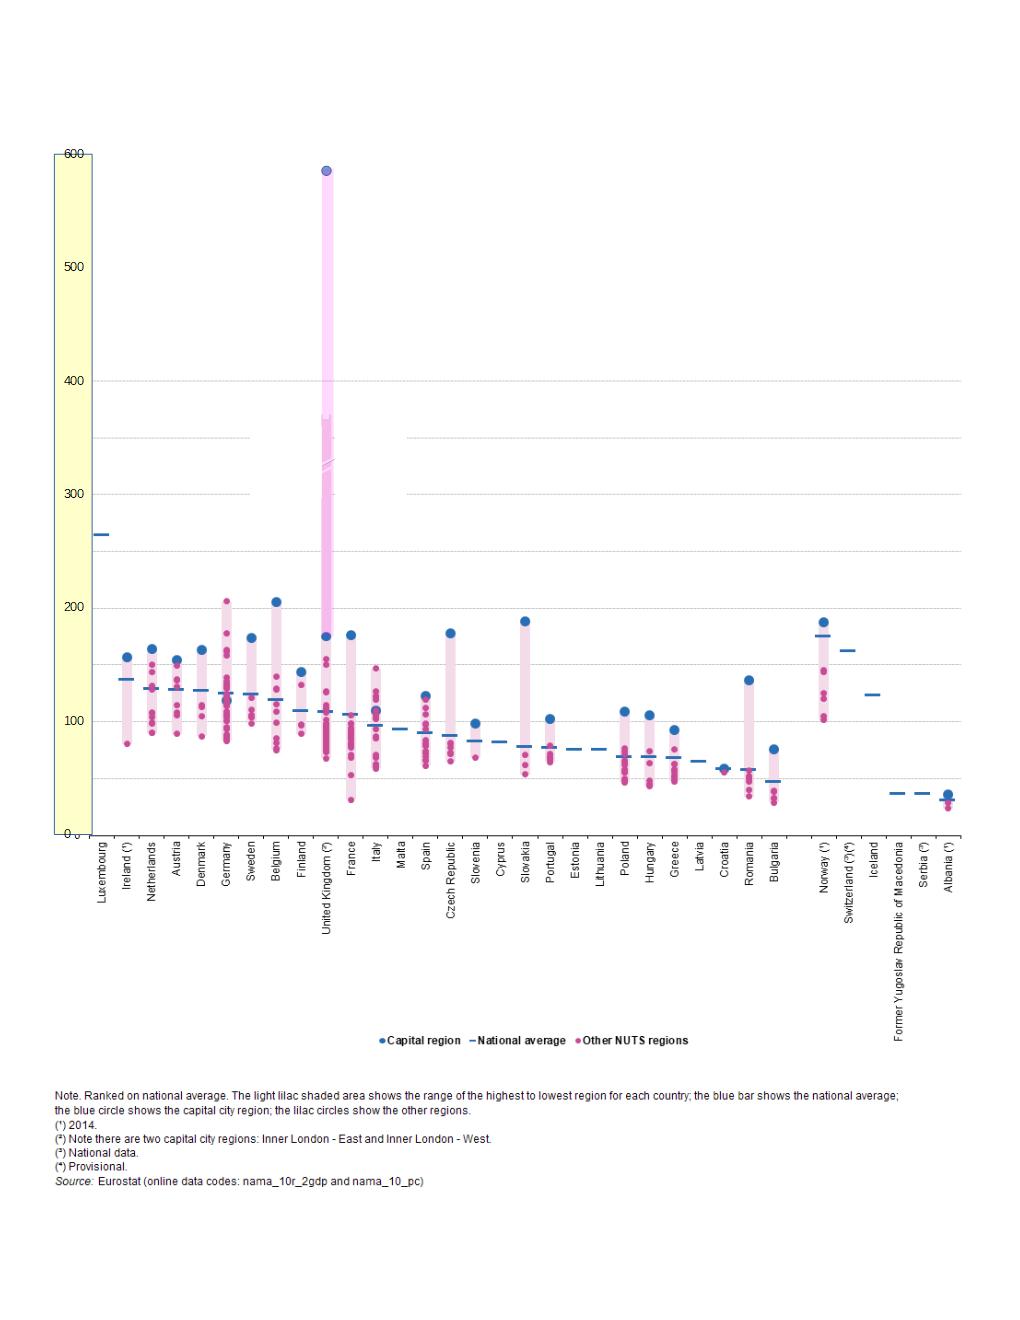
These diagrams have been adapted from the Eurostat site by using the same linear scale for all countries, in order to more accurately illustrate the scale of difference between the UK, and other major European economies. The original graphic on the Eurostat site is included below, for reference.